Что такое findslide.org?

FindSlide.org - это сайт презентаций, докладов, шаблонов в формате PowerPoint.


Для правообладателей

Обратная связь

Email: Нажмите что бы посмотреть 

Яндекс.Метрика

Презентация на тему по английскому языку на тему AUSTRALIA’S ECONOMY

Содержание

Australian EconomyProsperous, Western-style market economy World Bank classification:Low-income economies53 countries (e.g., Haiti)Lower-middle income economies55 countries (e.g., Guatemala)Upper-middle income economies41 countries (e.g., Mexico)High-income economies60 countries (e.g., Australia)
AUSTRALIA’S ECONOMY Australian EconomyProsperous, Western-style market economy World Bank classification:Low-income economies53 countries (e.g., Haiti)Lower-middle Composition of GDP (%)					Australia 		U.S.Agriculture		   3.7		 0.9Industry			  25.6 Composition of Exports (%)					  Australia 		U.S.Minerals and Metals		60		 ?Rural Goods Australian EconomyMajor economic reforms starting in the 1980sFirst reform: Labor Party’s floating AUSTRALIA: Annual Changes in GDP and CPIGDPCPI Australian EconomyCurrent concernsLarge current account deficitAbsence of export-oriented manufacturing industryReal estate bubbleHigh POPULATIONAustralia			   20 millionUnited States		  294 millionChina			1,300 millionIndia			1,073 millionWorld			6,390 million World Population DensityPopulation (bottom) and Internet (top) densities Australian Population Density    0-100     100-200 Annual Population Growth, Australia 		1.16% per yearU.S.		1.12% per year Net Immigration Rate, Australia 		0.58% of total populationU.S.		0.40% of total population Foreign-Born Population, circaAustralia 		23%U.S.		11% Gross Domestic Product,  (billion U.S. dollars, PPP)Australia 		   700U.S.		12,400 World Gross Domestic Product (1999) Earth’s Satellite Picture at Night Per Capita GDP and GNP,  (U.S. dollars, PPP)Australia 		34,200 (GDP)	32,900 (GNP)U.S.		41,800 (GDP)	41,700 (GNP) Per Capita GNI and NNI, 2005 (U.S. dollars, PPP)Australia 		32,900 (GNI)	27,700 (NNI)U.S.		41,700 (GNI)	36,400 (NNI) Nominal GDP vs. PPP GNP Australian Dollar (AUD, A$, AU$)Currency of the Commonwealth of AustraliaIncludes Australia, Christmas Monetary Conversion RatesAUD per U.S. dollar Exchange RateAUD per U.S. dollar Real Annual GDP Growth, Australia 		3.8%U.S.		3.2% Annual Inflation (GDP Deflator), 1992-2005Australia 		2.4%U.S.		2.1% Long-Term Interest Rates, Australia 		6.6%U.S.		5.5% Unemployment Rates, Australia 		6.9%U.S.		5.1% Government Net Borrowing-Lending as % of GDP, Australia 		 1.6%U.S.		-4.4% Government Debt as % of GDPAustralia 		 1.6%U.S.		-4.4% Taxes on Income and Profits as % of GDP, Australia 		18.2%U.S.		11.1% Taxes on Goods and Services as % of GDP, Australia 		8.9%U.S.		4.7% Household Expenditures in Recreation and Culture as % of GDP, Australia 		7.1%U.S.		6.4% Infant Mortality, Australia 		4.7 deaths per 1000 live birthsU.S.		6.8 deaths per 1000 live births Life Expectancy at Birth, 2004Australia 		80.6 yearsU.S.		77.5 years Prison Population Rate, Australia 		120 per 100,000 peopleU.S.		725 per 100,000 people GINI Index (higher income inequality, higher index)Australia 		35U.S.		45 Annual Water Consumption per Capita, Australia 		930 m3U.S.	   1,739 m3 Trade-to-GDP Ratio, Australia 		21%U.S.		13% AUSTRALIA Trade in Goods and Services AUSTRALIA: ExportsSTM: Simply-transformed manufacturesETM: Elaborately-transformed manufactures AUSTRALIA: Exports AUSTRALIA: ImportsSTM: Simply-transformed manufacturesETM: Elaborately-transformed manufactures AUSTRALIA: Imports Destinations of Exports (%)AUSTRALIAJapan (20%)China (12%)South Korea (8%)U.S. (6%)India (6%)New Zealand (6%)U.S.Canada Origins of Imports (%)AUSTRALIAChina (14%)U.S. (14%)Japan (10%)Singapore (6%)Germany (5%)U.S.Canada (16%)China (16%)Mexico (10%)Japan (8%)Germany (5%) Australia: Free Trade AgreementsFree Trade Agreements:U.S. (AUSFTA, started in 2005)Singapore (SAFTA, started AUSTRALIA Balance of Trade and Current Account AUSTRALIA Major Ag Policy Developments Reduction of trade-distorting support schemes for producersMajor Producer Support Estimates as % of Gross Farm Receipts AUSTRALIA Farm Support Schemes Tax arrangements and risk-management tools to manage income Australia Wheat BoardNear-monopoly for Australian wheat exportsAWB currently exports 96% of Australian THE END
Слайды презентации

Слайд 2 Australian Economy
Prosperous, Western-style market economy
World Bank classification:
Low-income

Australian EconomyProsperous, Western-style market economy World Bank classification:Low-income economies53 countries (e.g.,

economies
53 countries (e.g., Haiti)
Lower-middle income economies
55 countries (e.g., Guatemala)
Upper-middle

income economies
41 countries (e.g., Mexico)
High-income economies
60 countries (e.g., Australia)

Слайд 3 Composition of GDP (%)
Australia U.S.
Agriculture 3.7

Composition of GDP (%)					Australia 		U.S.Agriculture		  3.7		 0.9Industry			 25.6	  20.6Services		 	 70.7	  78.5

0.9
Industry 25.6 20.6
Services

70.7 78.5

Слайд 4 Composition of Exports (%)
Australia U.S.
Minerals and

Composition of Exports (%)					 Australia 		U.S.Minerals and Metals		60		 ?Rural Goods		 	17	   9Manufactured Goods	18		 82

Metals 60 ?
Rural Goods 17

9
Manufactured Goods 18 82

Слайд 5 Australian Economy
Major economic reforms starting in the 1980s
First

Australian EconomyMajor economic reforms starting in the 1980sFirst reform: Labor Party’s

reform: Labor Party’s floating of AUD in 1983
Free-trade agreements

and reduction of trade barriers
Financial sector deregulation, including 1992 access for foreign bank branches
Rationalization and reduction of trade unions
Restructuring of centralized system of industrial relations and labor bargaining
Better integration of individual state economies into federal system
Improvement and standardization of national infrastructure
Privatization (e.g., Australian Wheat Board)

Слайд 6 AUSTRALIA: Annual Changes in GDP and CPI
GDP
CPI

AUSTRALIA: Annual Changes in GDP and CPIGDPCPI

Слайд 7 Australian Economy
Current concerns
Large current account deficit
Absence of export-oriented

Australian EconomyCurrent concernsLarge current account deficitAbsence of export-oriented manufacturing industryReal estate

manufacturing industry
Real estate bubble
High levels of net foreign debt

owed by the private sector
Pressure on environment

Слайд 8 POPULATION
Australia 20 million
United States 294

POPULATIONAustralia			  20 millionUnited States		 294 millionChina			1,300 millionIndia			1,073 millionWorld			6,390 million

million
China 1,300 million
India 1,073 million
World 6,390 million


Слайд 9 World Population Density
Population (bottom) and Internet (top) densities

World Population DensityPopulation (bottom) and Internet (top) densities

Слайд 10 Australian Population Density
0-100

Australian Population Density  0-100   100-200    200-300    >300

100-200

200-300 >300


Слайд 11 Annual Population Growth,
Australia 1.16% per year
U.S. 1.12% per year

Annual Population Growth, Australia 		1.16% per yearU.S.		1.12% per year

Слайд 12 Net Immigration Rate,
Australia 0.58% of total population
U.S. 0.40% of

Net Immigration Rate, Australia 		0.58% of total populationU.S.		0.40% of total population

total population


Слайд 13 Foreign-Born Population, circa
Australia 23%
U.S. 11%

Foreign-Born Population, circaAustralia 		23%U.S.		11%

Слайд 14 Gross Domestic Product, (billion U.S. dollars, PPP)
Australia

Gross Domestic Product, (billion U.S. dollars, PPP)Australia 		  700U.S.		12,400

700
U.S. 12,400


Слайд 15 World Gross Domestic Product (1999)

World Gross Domestic Product (1999)

Слайд 16 Earth’s Satellite Picture at Night

Earth’s Satellite Picture at Night

Слайд 17 Per Capita GDP and GNP, (U.S. dollars, PPP)
Australia

Per Capita GDP and GNP, (U.S. dollars, PPP)Australia 		34,200 (GDP)	32,900 (GNP)U.S.		41,800 (GDP)	41,700 (GNP)

34,200 (GDP) 32,900 (GNP)
U.S. 41,800 (GDP) 41,700 (GNP)


Слайд 18 Per Capita GNI and NNI, 2005 (U.S. dollars, PPP)
Australia

Per Capita GNI and NNI, 2005 (U.S. dollars, PPP)Australia 		32,900 (GNI)	27,700 (NNI)U.S.		41,700 (GNI)	36,400 (NNI)

32,900 (GNI) 27,700 (NNI)
U.S. 41,700 (GNI) 36,400 (NNI)


Слайд 19 Nominal GDP vs. PPP GNP

Nominal GDP vs. PPP GNP

Слайд 20 Australian Dollar (AUD, A$, AU$)
Currency of the Commonwealth

Australian Dollar (AUD, A$, AU$)Currency of the Commonwealth of AustraliaIncludes Australia,

of Australia
Includes Australia, Christmas Island, Cocos (Keeling) Islands, and

Norfolk Island, as well as the independent Pacific Island states of Kiribati, Nauru and Tuvalu.
Introduced in 1966
Not only replacing the Australian pound (distinct from the pound sterling since 1929) but also introducing a decimal system.
Sixth-most-traded currency in world foreign exchange markets (behind U.S. dollar, euro, yen, pound sterling, and swiss franc)
AUD accounts for 4–5% of worldwide foreign exchange transactions.

Слайд 21 Monetary Conversion Rates
AUD per U.S. dollar

Monetary Conversion RatesAUD per U.S. dollar

Слайд 22 Exchange Rate
AUD per U.S. dollar

Exchange RateAUD per U.S. dollar

Слайд 23 Real Annual GDP Growth,
Australia 3.8%
U.S. 3.2%

Real Annual GDP Growth, Australia 		3.8%U.S.		3.2%

Слайд 24 Annual Inflation (GDP Deflator), 1992-2005
Australia 2.4%
U.S. 2.1%

Annual Inflation (GDP Deflator), 1992-2005Australia 		2.4%U.S.		2.1%

Слайд 25 Long-Term Interest Rates,
Australia 6.6%
U.S. 5.5%

Long-Term Interest Rates, Australia 		6.6%U.S.		5.5%

Слайд 26 Unemployment Rates,
Australia 6.9%
U.S. 5.1%

Unemployment Rates, Australia 		6.9%U.S.		5.1%

Слайд 27 Government Net Borrowing-Lending as % of GDP,
Australia

Government Net Borrowing-Lending as % of GDP, Australia 		 1.6%U.S.		-4.4%

1.6%
U.S. -4.4%


Слайд 28 Government Debt as % of GDP
Australia 1.6%
U.S. -4.4%

Government Debt as % of GDPAustralia 		 1.6%U.S.		-4.4%

Слайд 29 Taxes on Income and Profits as % of

Taxes on Income and Profits as % of GDP, Australia 		18.2%U.S.		11.1%

GDP,
Australia 18.2%
U.S. 11.1%


Слайд 30 Taxes on Goods and Services as % of

Taxes on Goods and Services as % of GDP, Australia 		8.9%U.S.		4.7%

GDP,
Australia 8.9%
U.S. 4.7%


Слайд 31 Household Expenditures in Recreation and Culture as %

Household Expenditures in Recreation and Culture as % of GDP, Australia 		7.1%U.S.		6.4%

of GDP,
Australia 7.1%
U.S. 6.4%


Слайд 32 Infant Mortality,
Australia 4.7 deaths per 1000 live

Infant Mortality, Australia 		4.7 deaths per 1000 live birthsU.S.		6.8 deaths per 1000 live births

births
U.S. 6.8 deaths per 1000 live births


Слайд 33 Life Expectancy at Birth, 2004
Australia 80.6 years
U.S. 77.5 years

Life Expectancy at Birth, 2004Australia 		80.6 yearsU.S.		77.5 years

Слайд 34 Prison Population Rate,
Australia 120 per 100,000 people
U.S. 725

Prison Population Rate, Australia 		120 per 100,000 peopleU.S.		725 per 100,000 people

per 100,000 people


Слайд 35 GINI Index (higher income inequality, higher index)
Australia 35
U.S. 45

GINI Index (higher income inequality, higher index)Australia 		35U.S.		45

Слайд 36 Annual Water Consumption per Capita,
Australia 930 m3
U.S.

Annual Water Consumption per Capita, Australia 		930 m3U.S.	  1,739 m3

1,739 m3


Слайд 37 Trade-to-GDP Ratio,
Australia 21%
U.S. 13%

Trade-to-GDP Ratio, Australia 		21%U.S.		13%

Слайд 38 AUSTRALIA Trade in Goods and Services

AUSTRALIA Trade in Goods and Services

Слайд 39 AUSTRALIA: Exports
STM: Simply-transformed manufactures
ETM: Elaborately-transformed manufactures

AUSTRALIA: ExportsSTM: Simply-transformed manufacturesETM: Elaborately-transformed manufactures

Слайд 40 AUSTRALIA: Exports

AUSTRALIA: Exports

Слайд 41 AUSTRALIA: Imports
STM: Simply-transformed manufactures
ETM: Elaborately-transformed manufactures

AUSTRALIA: ImportsSTM: Simply-transformed manufacturesETM: Elaborately-transformed manufactures

Слайд 42 AUSTRALIA: Imports

AUSTRALIA: Imports

Слайд 43 Destinations of Exports (%)


AUSTRALIA
Japan (20%)
China (12%)
South Korea (8%)
U.S.

Destinations of Exports (%)AUSTRALIAJapan (20%)China (12%)South Korea (8%)U.S. (6%)India (6%)New Zealand

(6%)
India (6%)
New Zealand (6%)


U.S.
Canada (22%)
Mexico (13%)
Japan (6%)
China (5%)
U.K. (4%)
Germany

(4%)

Слайд 44 Origins of Imports (%)


AUSTRALIA
China (14%)
U.S. (14%)
Japan (10%)
Singapore (6%)
Germany

Origins of Imports (%)AUSTRALIAChina (14%)U.S. (14%)Japan (10%)Singapore (6%)Germany (5%)U.S.Canada (16%)China (16%)Mexico (10%)Japan (8%)Germany (5%)

(5%)


U.S.
Canada (16%)
China (16%)
Mexico (10%)
Japan (8%)
Germany (5%)


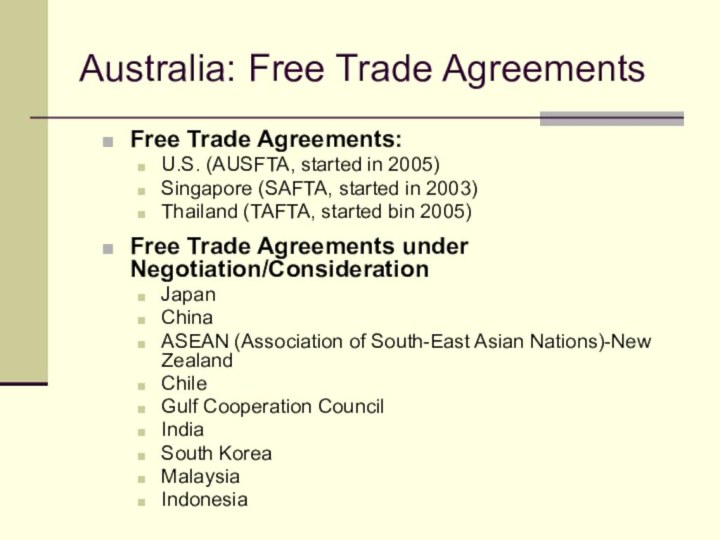
Слайд 45 Australia: Free Trade Agreements
Free Trade Agreements:
U.S. (AUSFTA, started

Australia: Free Trade AgreementsFree Trade Agreements:U.S. (AUSFTA, started in 2005)Singapore (SAFTA,

in 2005)
Singapore (SAFTA, started in 2003)
Thailand (TAFTA, started bin

2005)

Free Trade Agreements under Negotiation/Consideration
Japan
China
ASEAN (Association of South-East Asian Nations)-New Zealand
Chile
Gulf Cooperation Council
India
South Korea
Malaysia
Indonesia

Слайд 46 AUSTRALIA Balance of Trade and Current Account

AUSTRALIA Balance of Trade and Current Account

Слайд 47 AUSTRALIA Major Ag Policy Developments
Reduction of trade-distorting support schemes

AUSTRALIA Major Ag Policy Developments Reduction of trade-distorting support schemes for

for producers
Major reduction in support to dairy producers
Implementation of

drought-support measures
Emphasis in policies encouraging drought-preparedness amongst farmers
More economic-oriented policies for water usage
Expansion and strengthening of natural resource and environmental policies, mainly aimed at preventing soil degradation
Streamlining of sanitary measures for imports

Слайд 48 Producer Support Estimates as % of Gross Farm Receipts

Producer Support Estimates as % of Gross Farm Receipts

Слайд 49 AUSTRALIA Farm Support Schemes
Tax arrangements and risk-management tools to

AUSTRALIA Farm Support Schemes Tax arrangements and risk-management tools to manage

manage income fluctuations
Excise tax rebates on diesel used by

farmers
Accelerated depreciation for land and water-conservation investments
Publicly funded research and development
Assistance for exceptional situations (e.g., droughts and floods)
Import tariffs on certain types of cheese, unprocessed tobacco, and processed fruits and vegetables

Слайд 50 Australia Wheat Board
Near-monopoly for Australian wheat exports
AWB currently

Australia Wheat BoardNear-monopoly for Australian wheat exportsAWB currently exports 96% of

exports 96% of Australian wheat
Created in 1939
Served as model

for Canadian Wheat Board
Government-controlled until 1999
Privatized in 1999 (owned by active wheat growers)
Publicly traded in Australian Stock Exchange since 2001

  • Имя файла: prezentatsiya-po-angliyskomu-yazyku-na-temu-australias-economy.pptx
  • Количество просмотров: 135
  • Количество скачиваний: 1