- Главная
- Разное
- Бизнес и предпринимательство
- Образование
- Развлечения
- Государство
- Спорт
- Графика
- Культурология
- Еда и кулинария
- Лингвистика
- Религиоведение
- Черчение
- Физкультура
- ИЗО
- Психология
- Социология
- Английский язык
- Астрономия
- Алгебра
- Биология
- География
- Геометрия
- Детские презентации
- Информатика
- История
- Литература
- Маркетинг
- Математика
- Медицина
- Менеджмент
- Музыка
- МХК
- Немецкий язык
- ОБЖ
- Обществознание
- Окружающий мир
- Педагогика
- Русский язык
- Технология
- Физика
- Философия
- Химия
- Шаблоны, картинки для презентаций
- Экология
- Экономика
- Юриспруденция
Что такое findslide.org?
FindSlide.org - это сайт презентаций, докладов, шаблонов в формате PowerPoint.
Обратная связь
Email: Нажмите что бы посмотреть
Презентация на тему Transport modes in European city in a European city 1960 - 2000
Содержание
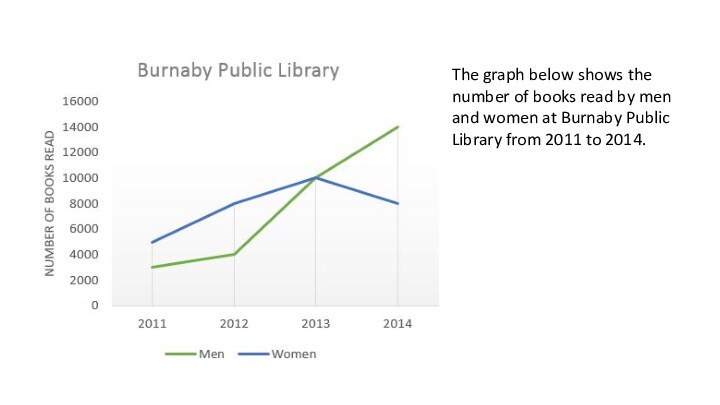
- 2. The chart shows components of GDP in the UK from 1992 to 2000.
- 3. The pie charts show the electricity generated
- 4. The pie chart shows the amount of
- 5. The illustrations show how chocolate is produced.
- 6. The illustrations show fish canning process.
- 7. The line graph shows thefts per thousand vehicles in four European countries between 1990 and 1999.
- 8. Скачать презентацию
- 9. Похожие презентации
The chart shows components of GDP in the UK from 1992 to 2000.


